The Mythological Transceiver
In this exhibit, the camera becomes a device that extends human perception far beyond the visible spectrum, translating unseen environmental signals into striking visual output. At its center is the Mythological Transceiver, an apparatus designed to detect how modern 5G frequencies are agitating the ancient, dormant spirits of the Ticinese Alps.
The artwork explores a captivating narrative: high-frequency 5G signals are actively “burning” these ethereal entities, forcefully driving them out of the stone and into our physical dimension. Here, digital noise and visual distortions act as the visible traces of this invisible, supernatural friction. These distortions serve as the physical footprints of an invisible phenomenon, elevating a modern conspiracy theory into an immersive conceptual artwork.
Assets
Video
Selected images
Concept
At its core, the project transforms the camera into a Mythological Transceiver, an instrument that extends human perception far beyond the visible spectrum. By capturing and translating invisible environmental signals into tangible visual output, the device bridges the gap between the unseen and the observed. The resulting visual distortions act as physical traces of invisible phenomena, effectively turning modern technological paranoia and conspiracy theories into a profound, conceptual visual experience.
Context
The narrative is deeply rooted in the landscape of the Ticinese Alps, a region where ancient, dormant spirits are said to reside within the stone. In this setting, the invisible web of modern infrastructure clashes with ancient mythology. The intense, high-frequency signals of contemporary 5G networks are imagined as a disruptive force that is literally burning and agitating these primordial entities. This localized environmental tension illustrates a profound disturbance, as the unseen frequencies forcefully draw these ancient spirits out of the rock and into our physical dimension.
Research
We began our process by analyzing existing interaction design projects that utilize sensor technology. Our initial research explored three conceptual pillars: reincarnation, astral projection, and the visualization of the unseen through the camera magica. After synthesizing these ideas through mood boards, we narrowed our focus to the intersection of 5G conspiracy theories and local Ticino folklore. This led to a refined visual direction and a concrete conceptual framework for our final object.
Interaction Design
The interaction between the user and the object
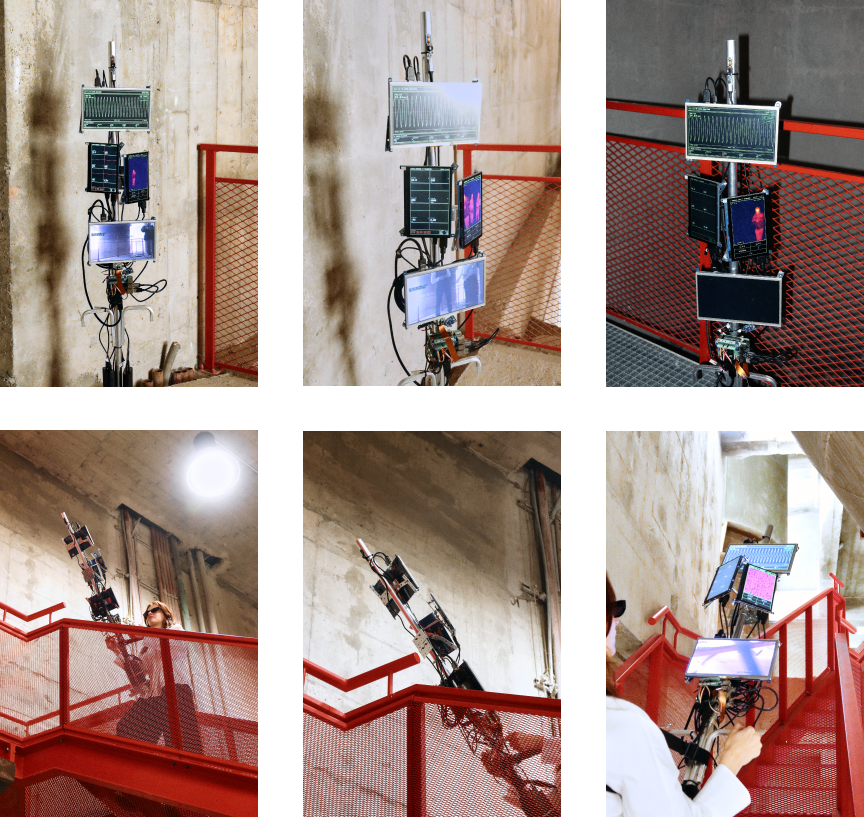
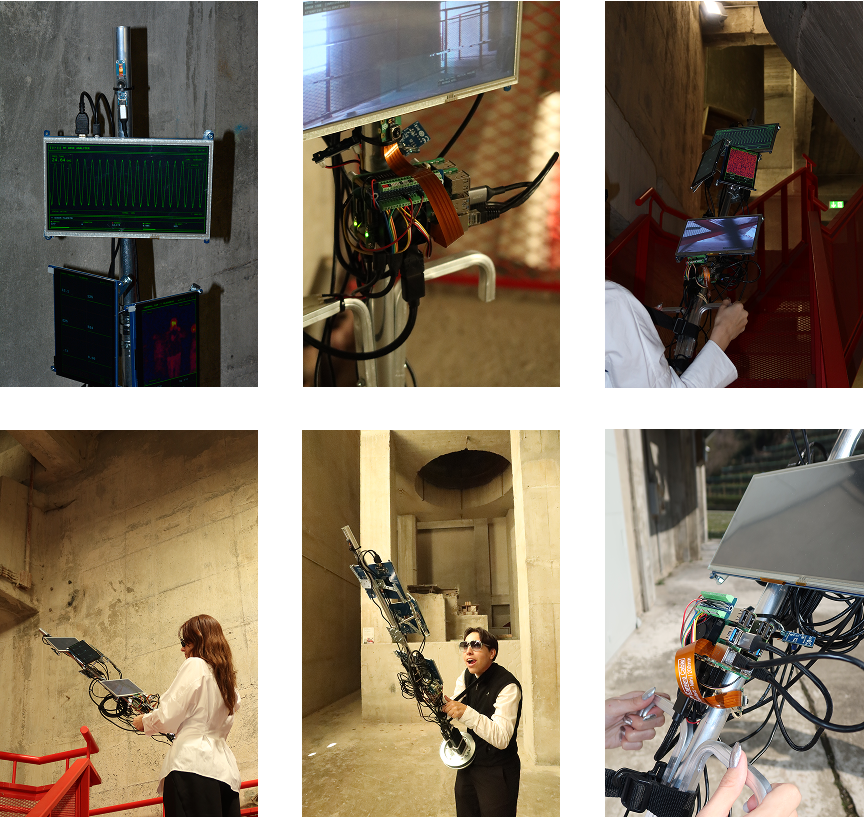
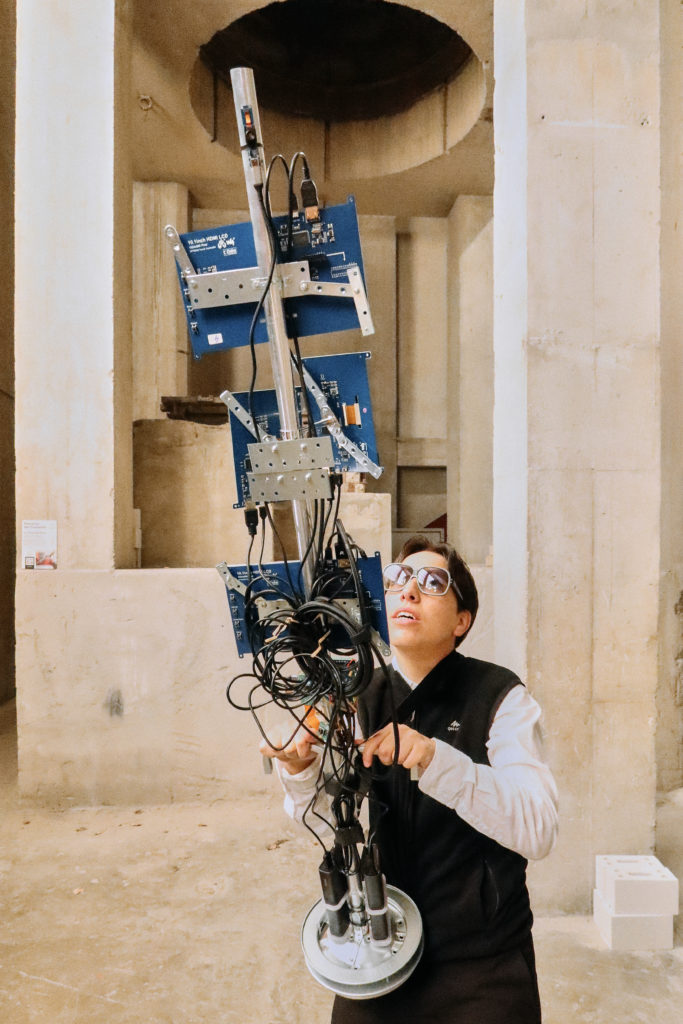
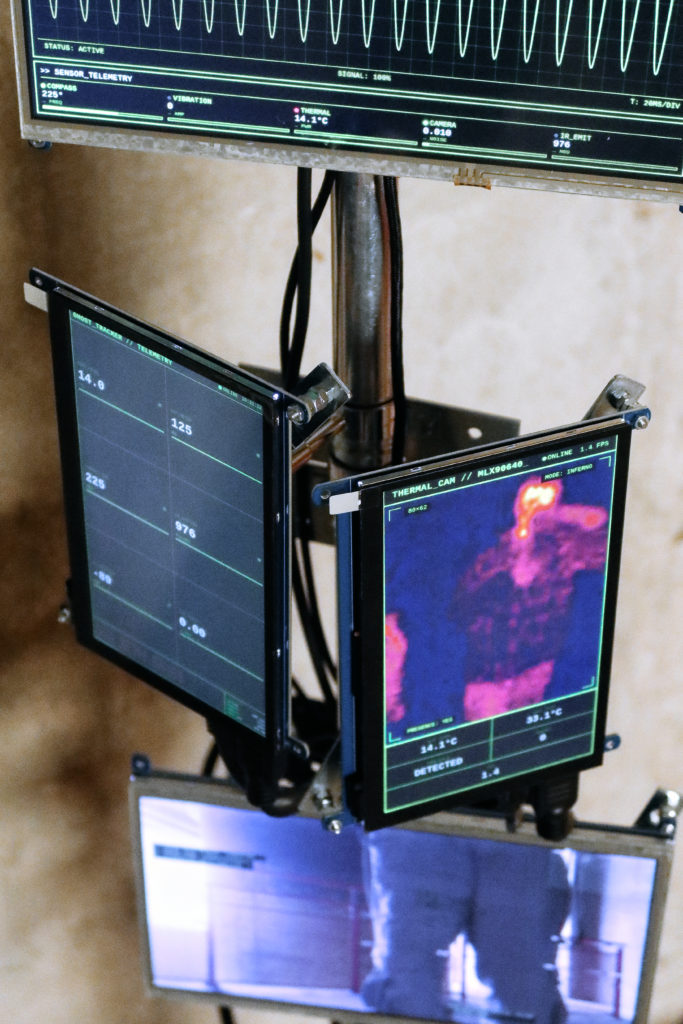
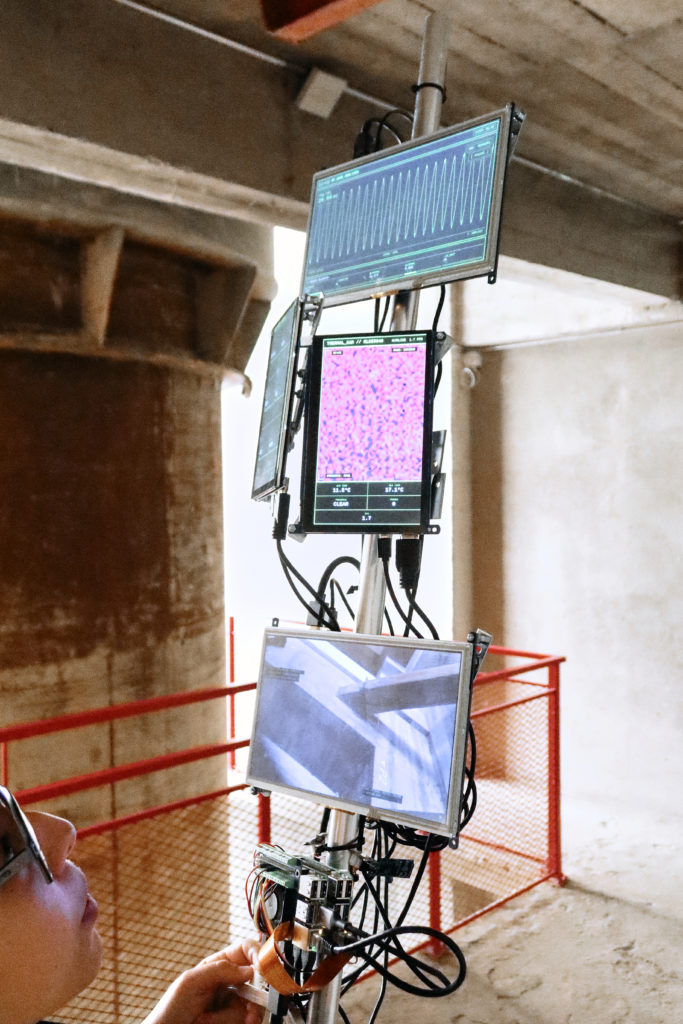
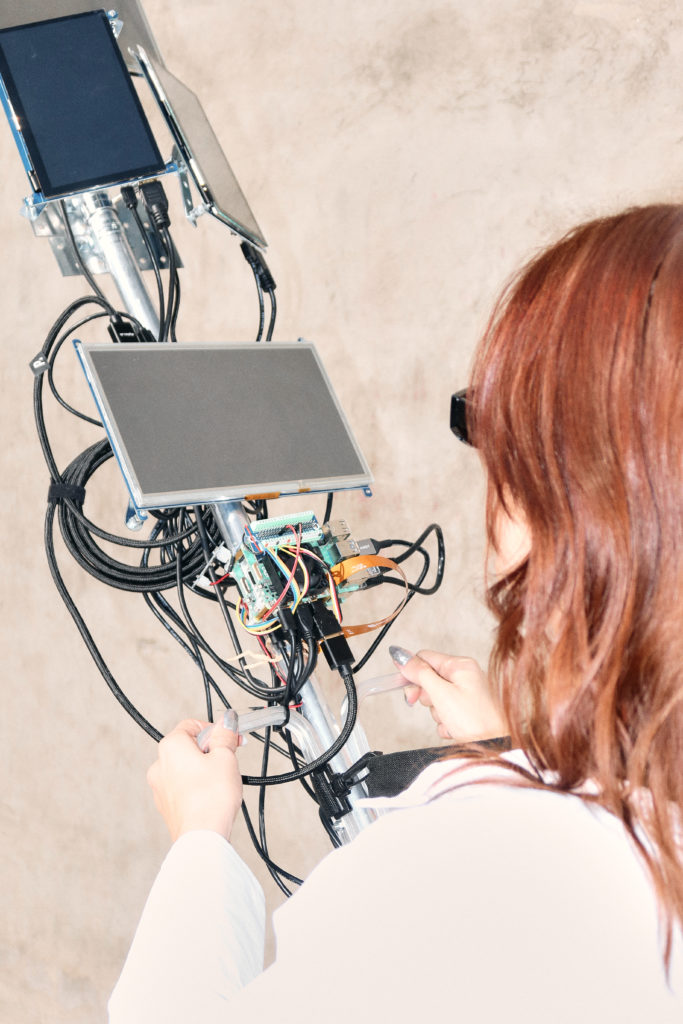
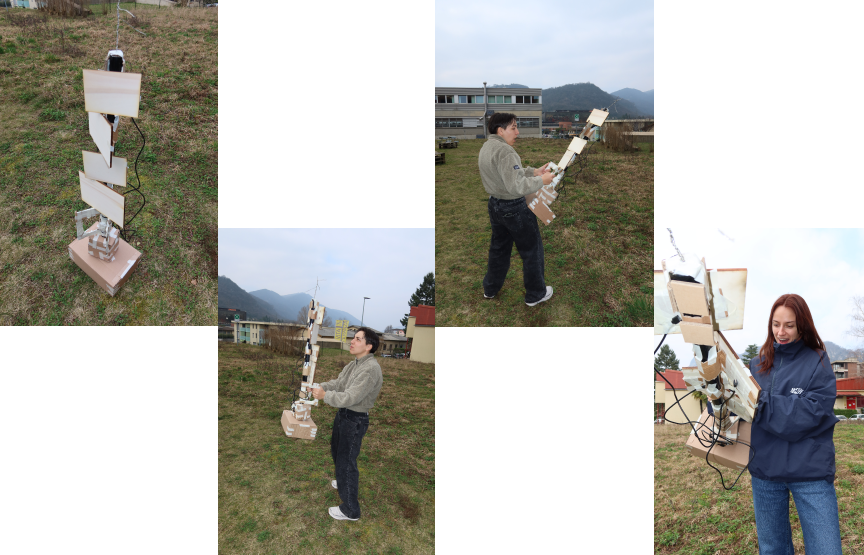
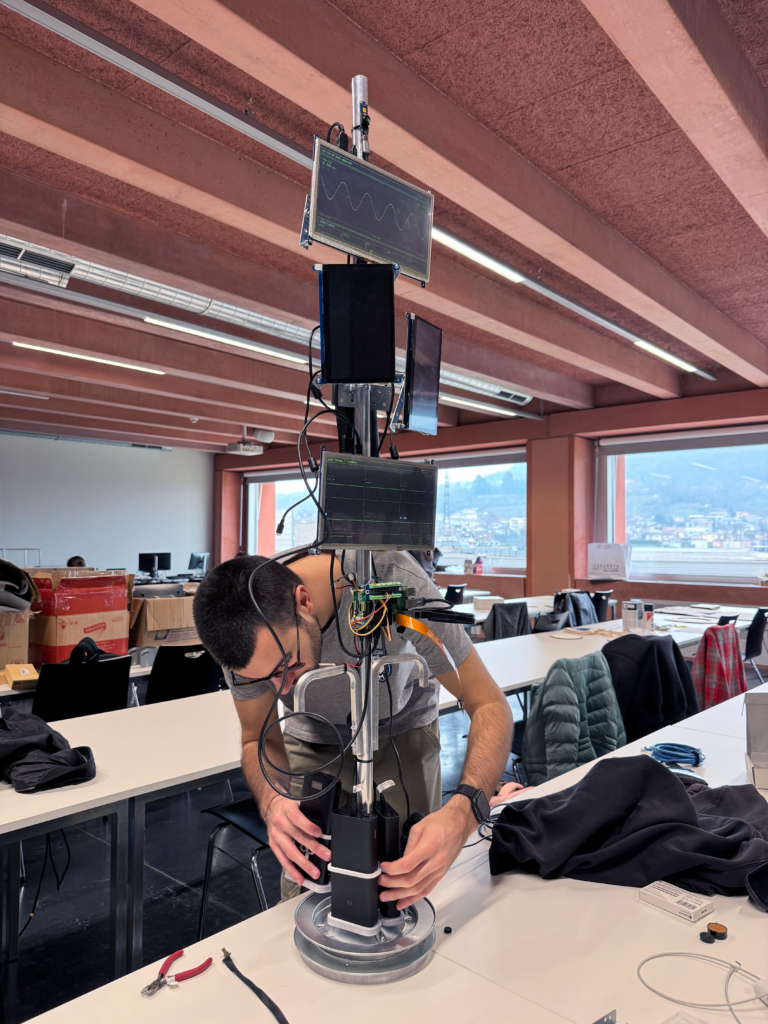
Our object allows the user, through its sensors and four displays, to detect alterations in the world that are invisible to the human eye. First of all, the user must pick up the device, which has two handles and a shoulder strap, turn it on, and, most importantly, choose a suitable place to search for ghosts.
Thanks to its sensors, the displays show different types of information. One screen indicates variations in the 5G signal; another uses a thermal camera to display temperature changes in a direct and visual way. A third screen presents a series of data such as external temperature, frequency, altitude, longitude, and wind. The fourth screen shows real-time images with visual distortions and superimposed data.
The user walks with the device while searching for ghosts and receives information through the sensors and the screens.
Sensors & Integration
List of sensors used and their purpose
- Thermal Camera: Visualizes the heat-leaks of the spirits, invisible to the eye but caught by your lens.
- Microphone/Vibration: Captures the infra-sound communication of the spirits
- EMF/Magnetometer: Measures the clash between 5G signals and Earth Energy. It proves that 5G towers are performing a continuous, invisible exorcism, pulling folklore out of the earth and into the air.
- Light/IR: Tracks the spectral flickering caused by frequency interference; the moment a spirit myth renders into our world.
Visual Output of Sensors
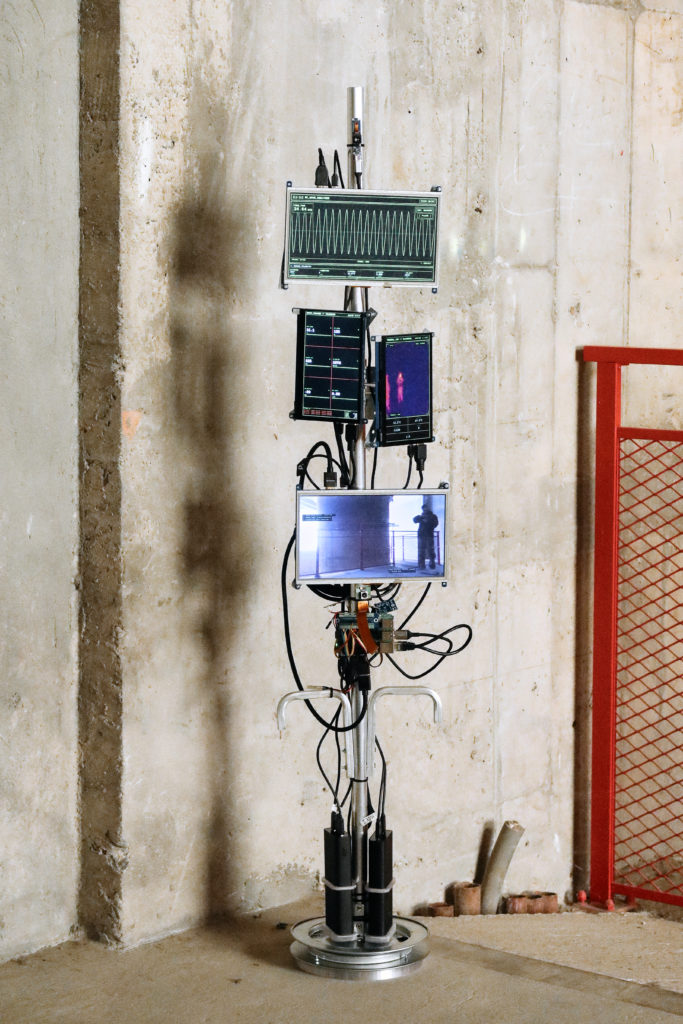
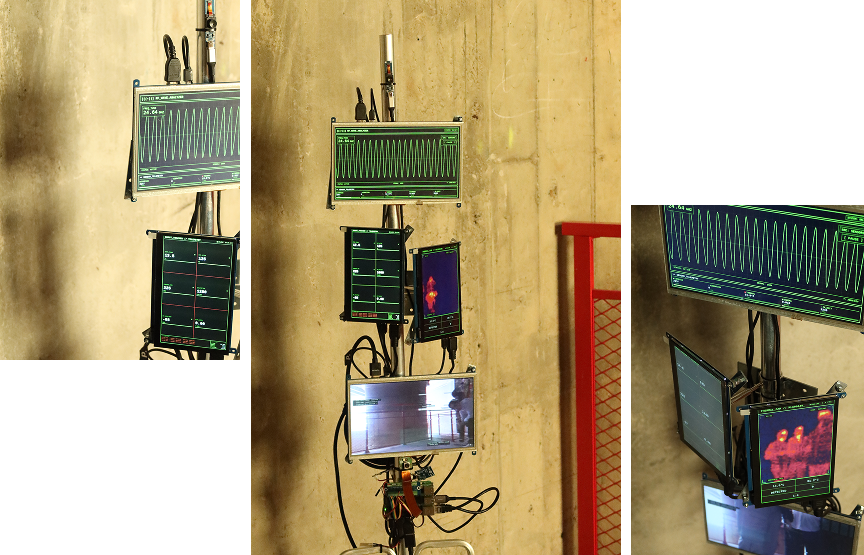
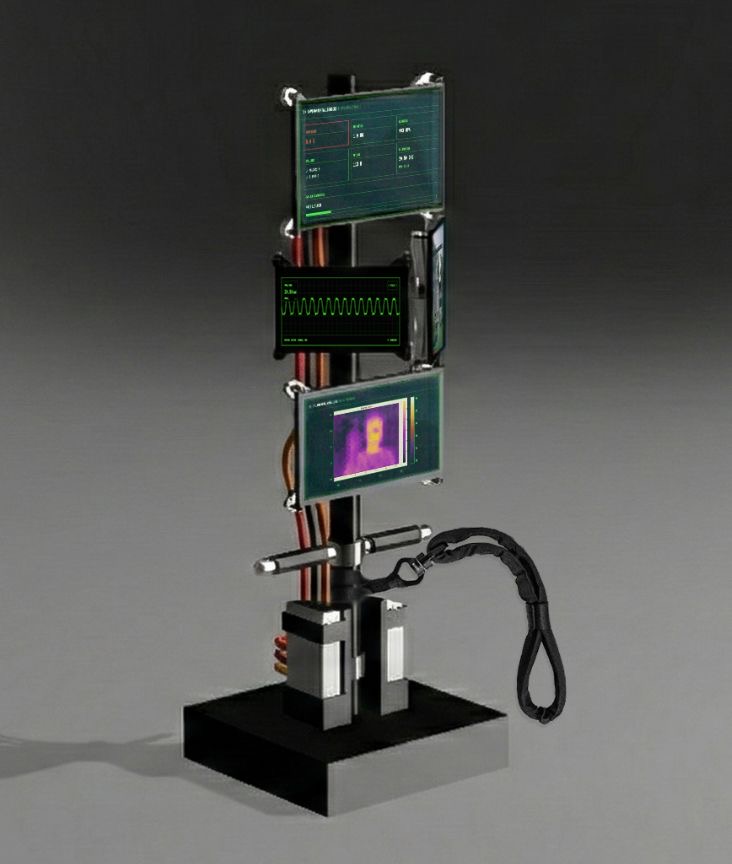
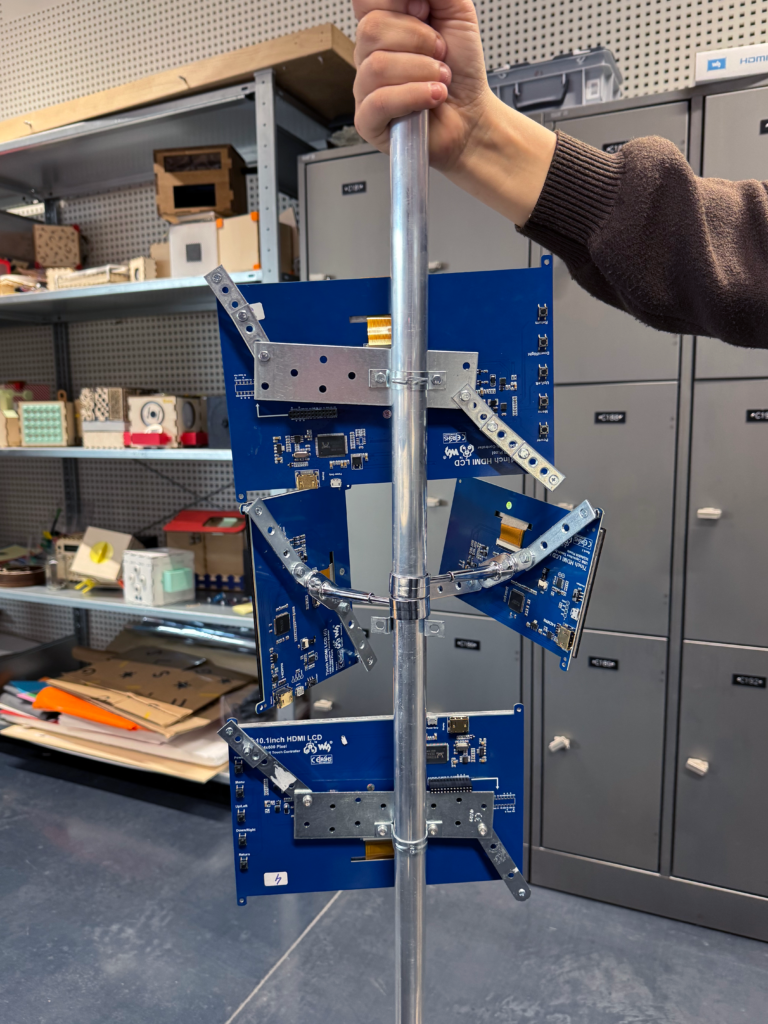
Four displays on a steel pole, each display presenting different types of information:
- First screen will show data collected from various sensors and cameras.
- Second screen will display the captured wavelengths with sound.
- Third screen will present images or visual outputs that are dynamically processed through inserting the data gathered in real time.
- The final screen will show the live feed from the cameras.
Prototyping Phases
Phase 1 - Sketching & Cardboard Prototype
Parallel to sourcing the necessary sensors and technical components, we began sketching potential forms for the device. Our goal was to design a portable, self-contained object that integrates all sensors and features built-in displays to provide immediate visual feedback.
After sketching we built our object true to size in cardboard and wood.
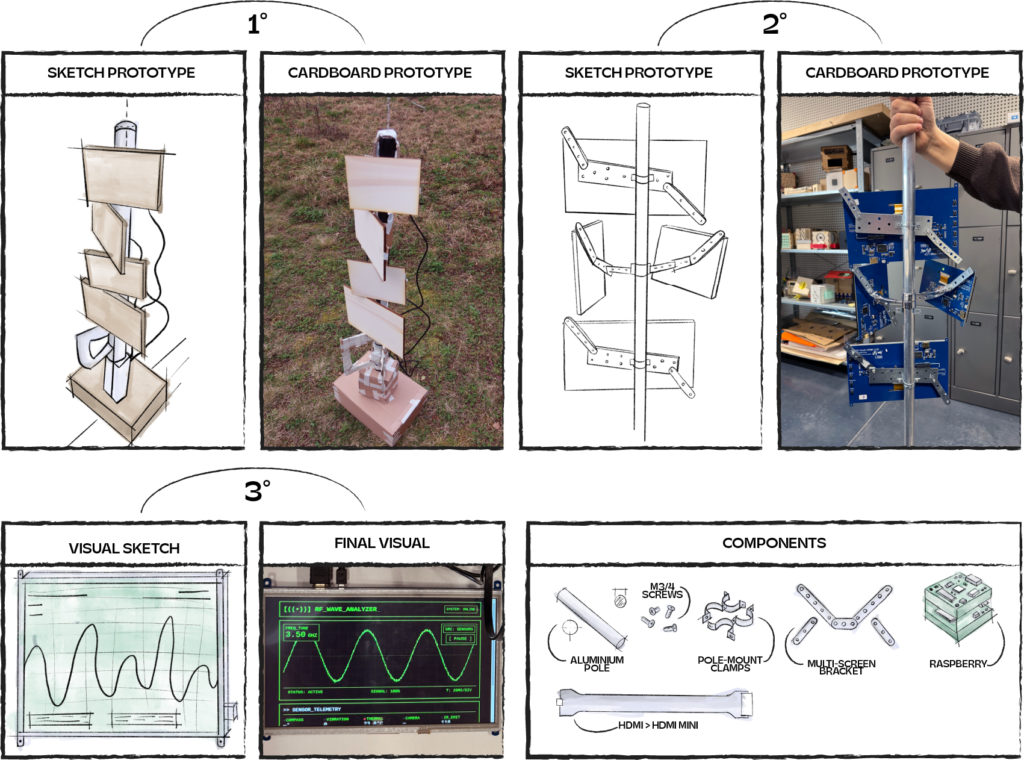
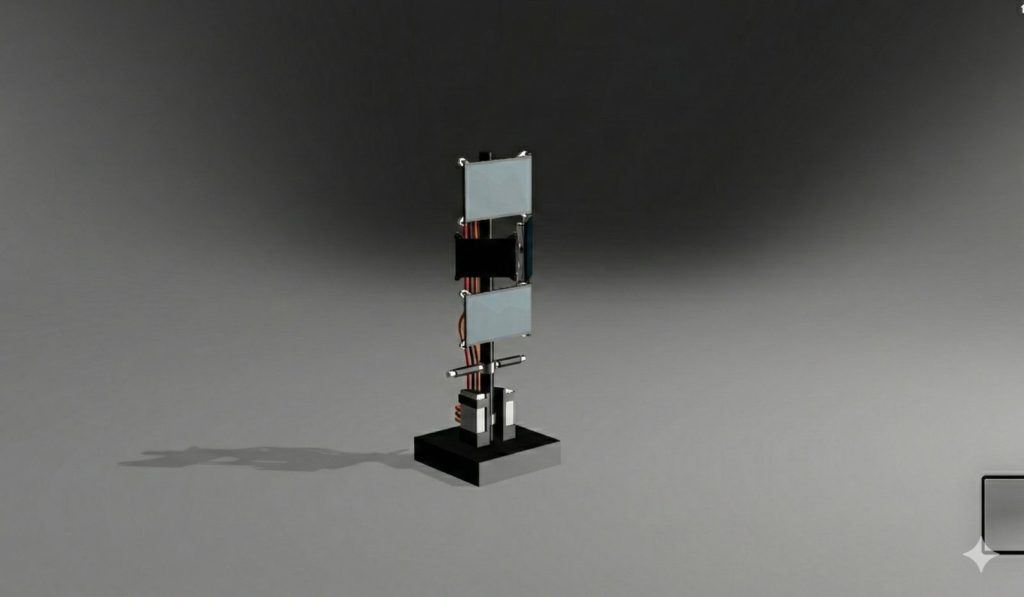
Phase 2 - 3D Modelling in Fusion
To better visualize and communicate our concept, we developed a detailed 3D model in Fusion. This allowed us to generate high-fidelity renders and bring our vision to life before physical assembly. Modeling the object was a crucial step in our spatial planning; it helped us determine the precise placement of sensors, displays, and handles, while identifying missing components and the specific materials required for construction.
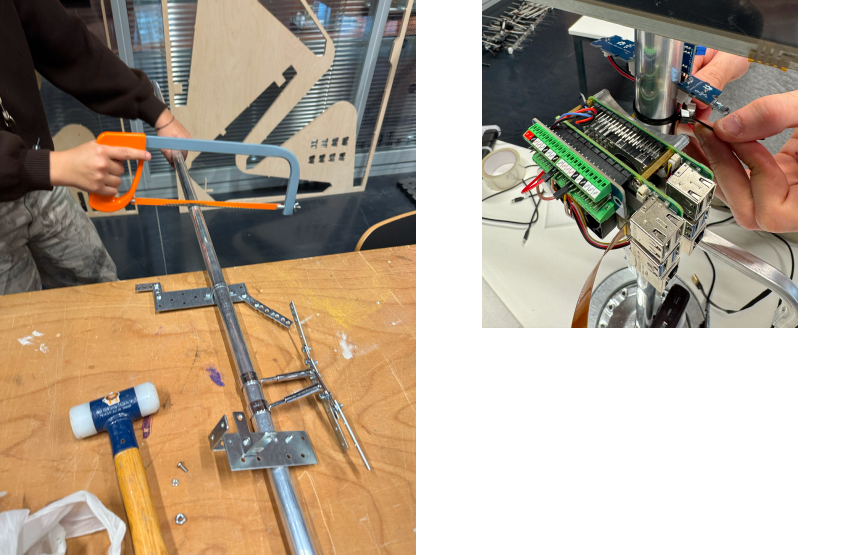
Phase 3 - Gathering the Materials & Building the Object
To transition from digital model to physical object, we sourced raw materials that matched our industrial aesthetic. By utilizing a metal pole and structural hardware to mount the displays, we intentionally minimized the use of 3D printing. This approach ensured the final piece retained a raw, tactile metal finish consistent with our vision.
Technical Implementation
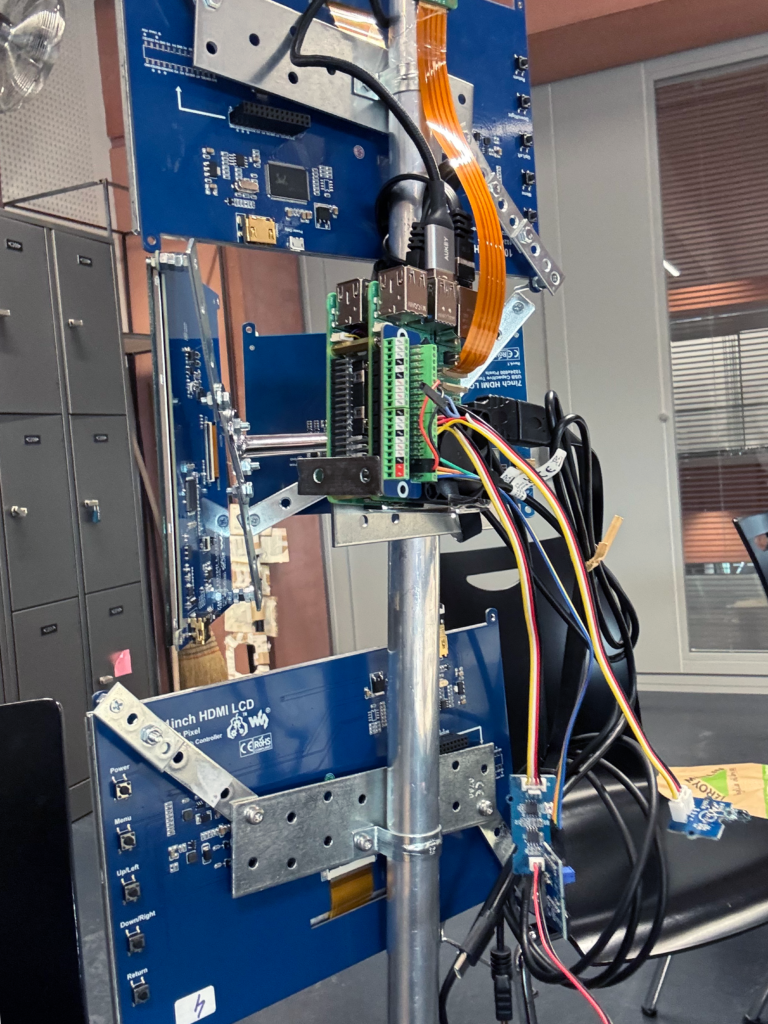
The installation is a distributed real-time system composed of two Raspberry Pi
single-board computers connected via a direct gigabit Ethernet cable. The Master
node (Raspberry Pi 5) owns all hardware sensors and runs the decision engine; the
Node (Raspberry Pi 4) mirrors state and drives its own pair of displays. Together
they power four independent browser-based screens showing generative visuals that
react to the physical environment in real time.
The software is written in C++20 and compiled with CMake. Both binaries link
against a shared static library that provides the message protocol, thread-safe
queues, clock synchronisation, WebSocket server (Boost.Beast), and ZeroMQ
transport wrappers. The frontend is pure vanilla JavaScript (no frameworks, no
bundlers) rendered inside Chromium instances running in kiosk mode under the
labwc Wayland compositor.
Hardware
- Master (RPi 5): * Thermal Camera: 32×24 array (upscaled) via Python bridge.
- RGB Camera: 640×480 @ 5 FPS for glitch visuals.
- Compass: I2C magnetometer with periodic degaussing and EMI filtering.
- Vibration/IR/Buzzer: GPIO-based sensors and actuators; buzzer frequency responds to proximity metrics.
- Node (RPi 4): No local sensors; drives two HDMI displays (Telemetry and RF Spectrum).
Software Architecture
The system utilizes a multi-threaded model to ensure non-blocking I/O and sensor polling:
- Master (6 threads): Logic, ZMQ Pub, ZMQ Sync, WebSocket, Scalar Sensors (~20 Hz), and Cameras.
- Node (4 threads): Logic, ZMQ Sub, WebSocket, and Health/Sync.
- Concurrency: Employs bounded MPMC MessageQueue (4096 capacity), atomic stores, and std::jthread for thread safety without data races.
Communication Protocol
Format: JSON envelopes with microsecond timestamps.
ZeroMQ: PUB/SUB for state broadcasting; REQ/REP for node registration and NTP-style time sync (accuracy < 100 µs).
WebSockets: Async broadcasting of sensor data and scene changes to frontends via Boost.Beast.
State Machine & Scene Management
A finite state machine (FSM) manages 8 states (Idle, Aurora, Pulse, etc.).
The decision engine cycles scenes based on a schedule or sensor triggers.
State changes are synchronized across nodes.
SafeMode: Automated fallback if the Node loses connection to the Master for > 5 seconds.
Frontend Displays
All visuals are Vanilla JS/HTML5 Canvas:
thermal.html: Thermal feed with CRT effects and real-time stats.
camera.html: RGB feed with chromatic aberration and glitch effects.
telemetry.html: 6-card dashboard showing deterministic sensor metrics.
waves.html: RF spectrum analyzer modulated by sensor data.
app.js: Main generative engine running at 60 FPS.
Key Code Insights
EMI Mitigation: Buzzer silence gaps (150 ms) and spike filters protect compass readings from electromagnetic interference.
Polling Optimization: Compass polled last to prevent its recovery blocking other sensors.
Backpressure: Images are dropped if the WebSocket queue exceeds 1024–2048 items to prevent memory bloat.
Time Sync: 4-timestamp NTP algorithm with exponential moving average (alpha 0.15) for sub-millisecond coordination.
Deployment & Operations
OS: Raspberry Pi OS 64-bit (Bookworm) with labwc.
Services: Managed by systemd with CPU and Memory quotas.
Web: Nginx reverse-proxies WebSockets; Chromium windows are positioned via autostart scripts.
Watchdog: A cron-job script monitors process health and restarts services if failures occur.
Saceba Exhibition Gallery